Container Trade in Flux: Data Show Mixed Signals, October–November 2025
Shipping - Worldwide | 19/11/2025, Wednesday
Recent industry data for late-2025 indicate a nuanced picture: shifting capacity, selective regional strength, tariff-driven caution and rate volatility. Exporters, importers and logistics professionals should pay attention to the following trends.
Key Data from October–November 2025
-
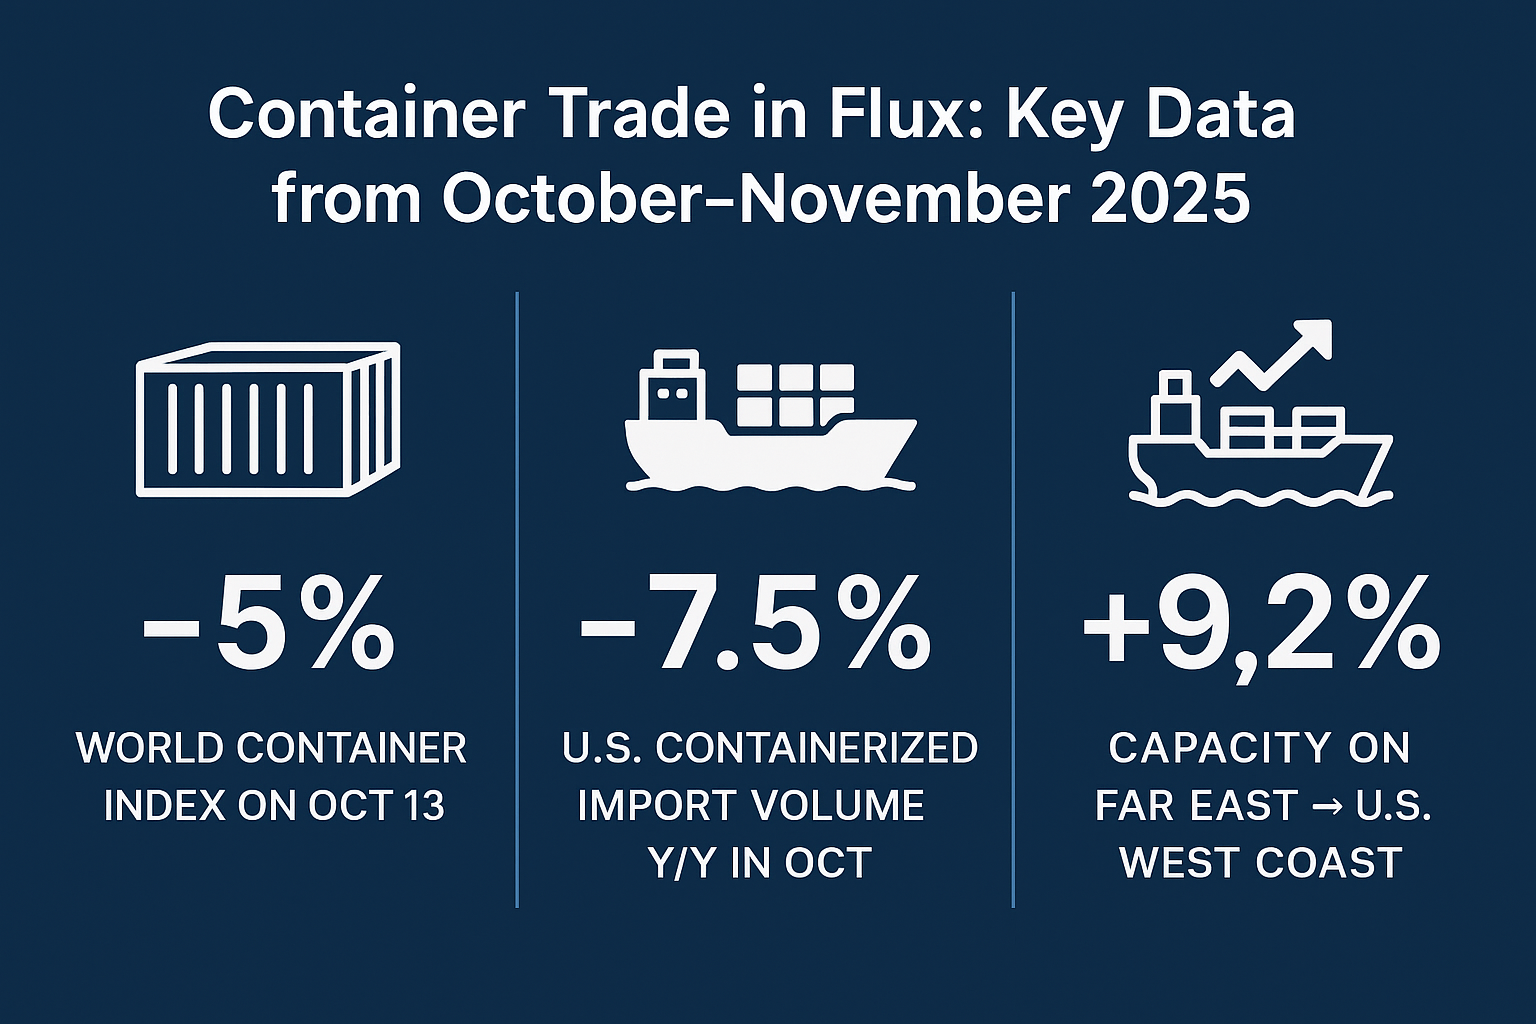
On October 13 2025 the Drewry Supply Chain Advisors “World Container Index” (WCI) dropped 5% to US$1,859 per 40-ft container.
-
The same week, spot rates from Shanghai to New York fell ~15% to US$3,254/40-ft and Shanghai to Los Angeles declined ~12% to US$2,328.
-
On the “Far East → U.S.”-type lanes (week commencing 10Nov) the Xeneta data showed: Far East → US West Coast: US$2,459/FEU; Far East → US East Coast: US$3,042/FEU; Far East → North Europe: US$2,258/FEU; Far East → Mediterranean: US$2,840/FEU.
-
Also from the same Xeneta update: offered capacity (4-week rolling average) on Far East → US West Coast was +9.2% week-on-week; Far East → North Europe +5.1%; Far East → Mediterranean +8.9%.
-
In October 2025 U.S. containerised import volumes were 2,306,687 TEUs, nearly flat month-on-month from September but down 7.5% year-on-year.
-
At the Port of Los Angeles (October 2025): loaded imports 429,283 TEUs (-7% y/y); loaded exports 123,768 TEUs (+1% y/y).
-
On key East-West routes, carriers withdrew ~7% of sailings in early November on East–West trades, helping to stabilise rates
-
The JM Rodgers Co. October update noted carriers were blanking 14% of Trans-Pacific capacity as they fought falling spot rates.
What Does This Mean?
-
Rate pressure remains: Despite tactical rate rises in some lanes, the overall trend shows downward pressure on spot rates, especially across major U.S. import flows (-7.5% y/y in U.S. volumes).
-
Capacity is creeping back: The capacity available on many main haul routes is rising again (e.g., +9.2% Far East → USWC). That suggests carriers are reinstating service rather than continuing extreme blank sailings.
-
Regional divergence: Some lanes (Far East → Europe) still have slightly positive dynamics (rates holding or slightly up), while the U.S. import lanes show softness.
-
Tariff & policy effects: The decline in U.S. volumes (e.g., China-origin imports down ~16% y/y) points to policy/tariff caution affecting demand.
-
Opacity & timing matter: Some recent spikes (per Freightos reports) indicate temporary rate rebounds (e.g., Asia→US up to 40-50% in early Nov) but these may not be sustained.
Strategic Implications:
-
Lock in capacity early on lanes where demand shows signs of recovery or stability (e.g., Far East → Europe).
-
Monitor rate spreads carefully: If one lane holds rates while another declines, margin optimisation is crucial.
-
Diversify sourcing/exporting corridors: Given the softness in U.S. import volumes, exploring alternative markets (Middle East, Africa, Indian Subcontinent) may yield advantage.
Bottom line: For Q4 2025, the container freight market is not in an outright boom, but neither is it collapsing. The data for October–November shows pockets of resilience, but also clear headwinds.